Ceilometer (Metering and Event Collection)
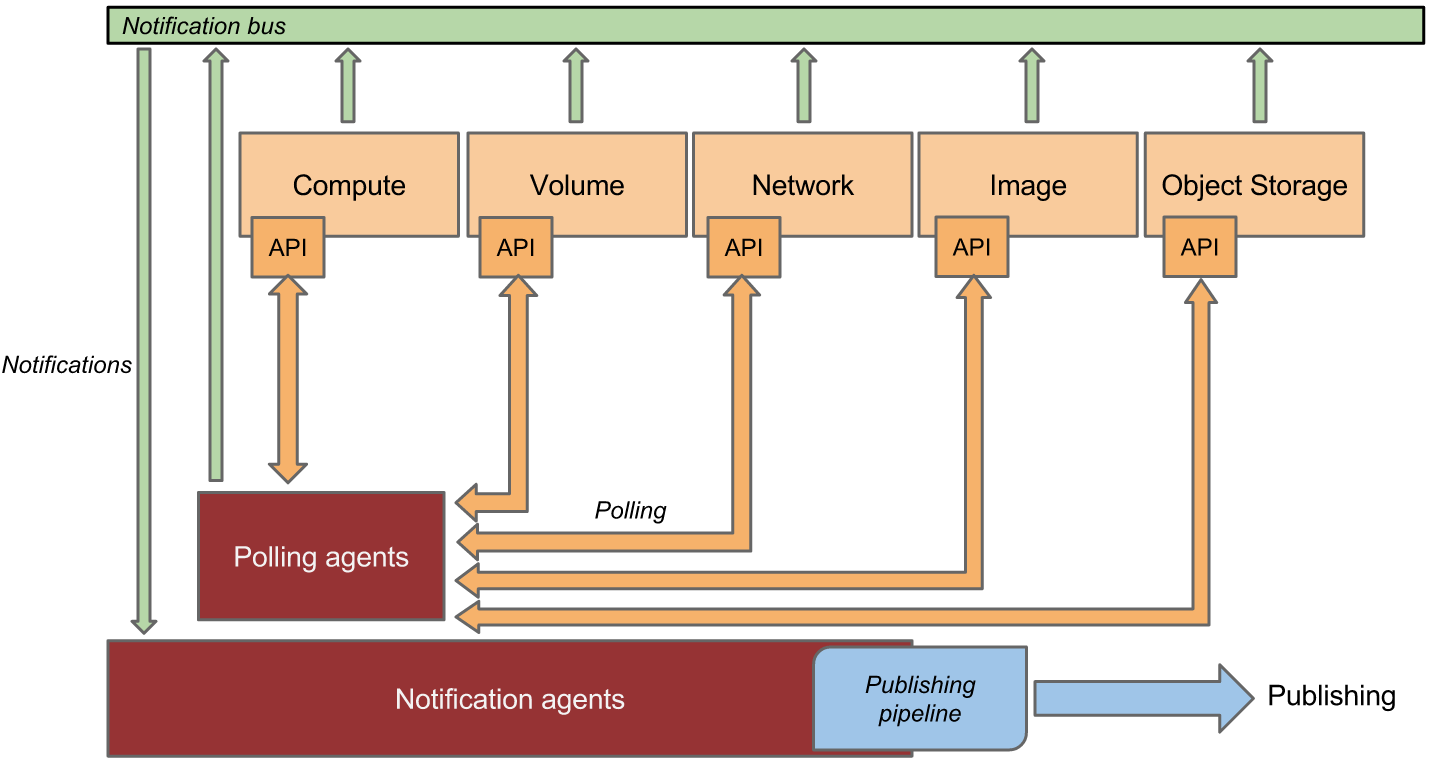
Ceilometer is the telemetry service in OpenStack responsible for collecting usage data related to different resources (e.g., instances, volumes, and network usage). It compiles various types of metrics (referred to as meters), such as CPU utilization, disk I/O, and network traffic. It does this by gathering data from other OpenStack components like Nova (compute), Cinder (block storage), and Neutron (networking). It also captures event data such as instance creation and volume attachment via hooks into the message notification system (RabbitMQ).
Configuration
Ceilometer’s configuration may initially seem complex due to the extensive number of event, metric, and resource definitions available. However, these definitions can be easily modified to adjust the data collected by the polling and notification agents, allowing users to fine-tune data collection based on their specific needs.
Events
Events are discrete occurrences, such as the starting or stopping of instances or attaching a volume which are captured and stored. Ceilometer builds event data from the messages it receives from other OpenStack services. Event definitions can be complex. Typically, a given message will match one or more event definitions that describe what the incoming payload should be flattened to. See the telemetry-events section of Ceilometer's documentation for more information.
Example event definitions for cinder volumes
- event_type: ['volume.exists', 'volume.retype', 'volume.create.*', 'volume.delete.*', 'volume.resize.*', 'volume.attach.*', 'volume.detach.*', 'volume.update.*', 'snapshot.exists', 'snapshot.create.*', 'snapshot.delete.*', 'snapshot.update.*', 'volume.transfer.accept.end', 'snapshot.transfer.accept.end']
  traits: &cinder_traits
    user_id:
      fields: payload.user_id
    project_id:
      fields: payload.tenant_id
    availability_zone:
      fields: payload.availability_zone
    display_name:
      fields: payload.display_name
    replication_status:
      fields: payload.replication_status
    status:
      fields: payload.status
    created_at:
      type: datetime
      fields: payload.created_at
    image_id:
      fields: payload.glance_metadata[?key=image_id].value
    instance_id:
      fields: payload.volume_attachment[0].instance_uuid
- event_type: ['volume.transfer.*', 'volume.exists', 'volume.retype', 'volume.create.*', 'volume.delete.*', 'volume.resize.*', 'volume.attach.*', 'volume.detach.*', 'volume.update.*', 'snapshot.transfer.accept.end']
  traits:
    <<: *cinder_traits
    resource_id:
      fields: payload.volume_id
    host:
      fields: payload.host
    size:
      type: int
      fields: payload.size
    type:
      fields: payload.volume_type
    replication_status:
      fields: payload.replication_status
Resources
Gnocchi resource definitions in Ceilometer's configuration define how resources like instances, volumes, and networks are represented and tracked for telemetry purposes. Each definition specifies the attributes (such as project ID or instance name) and the metrics (like CPU usage or network traffic) associated with that resource. When Ceilometer collects data from various OpenStack services, it uses these definitions to map the data to the appropriate resource type in Gnocchi (which stores it as time-series data). This structure allows for efficient monitoring, aggregation, and analysis of resource usage over time in a scalable way.
Example resource definition for cinder volumes
- resource_type: volume
  metrics:
    volume:
    volume.size:
    snapshot.size:
    volume.snapshot.size:
    volume.backup.size:
    backup.size:
    volume.manage_existing.start:
    volume.manage_existing.end:
    volume.manage_existing_snapshot.start:
    volume.manage_existing_snapshot.end:
  attributes:
    display_name: resource_metadata.(display_name|name)
    volume_type: resource_metadata.volume_type
    image_id: resource_metadata.image_id
    instance_id: resource_metadata.instance_id
  event_create:
    - volume.create.end
  event_delete:
    - volume.delete.end
    - snapshot.delete.end
  event_update:
    - volume.attach.end
    - volume.transfer.accept.end
    - snapshot.transfer.accept.end
  event_attributes:
    id: resource_id
    project_id: project_id
    image_id: image_id
    instance_id: instance_id
Meters
Meters are quantitative measures like CPU time, memory usage, or disk operations. Ceilometer provides several useful metrics by default, but new definitions can be added to suit almost every need. To read more about measurements and how they are captured, see the telemetry-measurements section of Ceilometer documentation.
Example metric definition for volume.size
- name: 'volume.size'
event_type:
  - 'volume.exists'
  - 'volume.retype'
  - 'volume.create.*'
  - 'volume.delete.*'
  - 'volume.resize.*'
  - 'volume.attach.*'
  - 'volume.detach.*'
  - 'volume.update.*'
  - 'volume.manage.*'
type: 'gauge'
unit: 'GB'
volume: $.payload.size
user_id: $.payload.user_id
project_id: $.payload.tenant_id
resource_id: $.payload.volume_id
metadata:
  display_name: $.payload.display_name
  volume_type: $.payload.volume_type
  image_id: $.payload.glance_metadata[?key=image_id].value
  instance_id: $.payload.volume_attachment[0].instance_uuid