Genestack Logging
- Genestack Logging
- Introduction
- Architecture
- OpenTelemetry Log Collection
- Loki Log Storage
- Log Storage Operations
- Accessing Logs Through Grafana
- Common Use Cases
- Using logcli (Command-Line Interface)
- Log Retention and Storage
- Troubleshooting
- Additional Resources
Introduction
Genestack logging is a modern, scalable system that collects, stores, and provides an interface to search and read logs on-demand. The storage backend is flexible to fit the needs of your deployment, whether backing up to OpenStack Swift, S3, Ceph, or file-share, Genestack logging can fit in your environment.
Out-of-the-box Genestack logging is comprised of three core technologies:
- OpenTelemetry - A vendor-neutral, open-source standard for telemetry collection. OpenTelemetry's filelog receiver collects logs from Kubernetes containers and OpenStack services, enriches them with metadata, and forwards them to Loki.
- Loki - A log aggregation system designed for Kubernetes that stores logs using label-based indexing in a time-series database. Loki is cost-effective and integrates seamlessly with Grafana for visualization.
- Grafana - Enables you to query, visualize, alert on, and explore your logs alongside metrics and traces in a unified interface.
These components work together to provide a complete logging solution while remaining modular enough to integrate with existing infrastructure if needed.
Architecture
Log Flow Overview
┌─────────────────────────────────────────────────────────────────────┐
│                      Log Collection & Storage                       │
└─────────────────────────────────────────────────────────────────────┘

Log Sources                Collector              Storage        Query
───────────                ─────────              ───────        ─────

/var/log/pods/  ──────┐
 (K8s containers)     │
                      ├──► OpenTelemetry  ──► Loki      ──► Grafana
/var/log/pods/  ──────┤    (filelog        │   (Index)      (Explore)
 (OpenStack svcs)     │     receiver)      │   (Store)      (Search)
                      │                    │                (Alert)
K8s Events  ──────────┘                    │
                                           │
                                           ▼
                                      S3/Swift/Ceph
                                     (Long-term Storage)
Component Roles
| Component | Role | Key Features |
|---|---|---|
| OpenTelemetry | Log collection and processing | Multi-line parsing, metadata enrichment, filtering |
| Loki | Log aggregation and indexing | Label-based indexing, cost-effective storage, LogQL |
| Grafana | Visualization and querying | Interactive search, dashboards, alerting |
| S3/Swift | Long-term storage | Durable object storage, cost-effective retention |
OpenTelemetry Log Collection
Overview
OpenTelemetry replaces traditional log collectors like Fluentbit with a unified, vendor-neutral approach to telemetry collection. The OpenTelemetry Collector uses the filelog receiver to gather logs from Kubernetes and OpenStack services.
Deployment
OpenTelemetry is deployed as a DaemonSet in Kubernetes, ensuring it runs on every node of the cluster. This allows it to:
- Access container logs directly from the host filesystem (
/var/log/pods) - Collect logs with minimal latency
- Automatically discover new pods and services
- Enrich logs with Kubernetes metadata
Log Sources
The OpenTelemetry filelog receiver collects logs from:
1. Kubernetes Container Logs
receivers:
  filelog/k8s_containers:
    include:
      - /var/log/pods/*/*/*.log
    exclude:
      - /var/log/pods/*/otel-collector/*.log
    start_at: end
    include_file_path: true
    operators:
      - type: container
        id: container-parser
What gets collected:
- All pod logs from /var/log/pods
- Automatic CRI (Container Runtime Interface) format parsing
- Pod metadata extraction (namespace, pod name, container name)
2. OpenStack Service Logs
receivers:
  filelog/openstack:
    include:
      - /var/log/pods/*/nova-*/*.log
      - /var/log/pods/*/neutron-*/*.log
      - /var/log/pods/*/keystone-*/*.log
      - /var/log/pods/*/cinder-*/*.log
      # ... other OpenStack services
    multiline:
      line_start_pattern: '^(\d{4}-\d{2}-\d{2}T\d{2}:\d{2}:\d{2}\.\d+Z stdout [FP] )?\d{4}-\d{2}-\d{2}[ T]\d{2}:\d{2}'
What gets collected: - OpenStack service logs (Nova, Neutron, Keystone, etc.) - Multi-line log messages (Python stack traces, exceptions) - Structured log parsing (timestamps, severity, components)
3. Kubernetes Events
receivers:
  k8sobjects:
    auth_type: serviceAccount
    objects:
      - name: events
        mode: watch
        namespaces: [openstack, kube-system, default]
What gets collected: - Kubernetes events (pod lifecycle, scheduling, errors) - Real-time event streaming - Namespace-specific event filtering
Log Processing Pipeline
OpenTelemetry processes logs through a series of operators:
1. Container Parser
Extracts metadata from the CRI log format:
2. Kubernetes Metadata Extraction
Adds resource attributes:
- k8s.namespace.name
- k8s.pod.name
- k8s.pod.uid
- k8s.container.name
- k8s.node.name
3. OpenStack Log Parsing
Parses standard OpenStack log format:
2024-03-17 12:34:56.789 12345 INFO nova.compute.manager [req-abc-123] Log message
└──────────┬──────────┘ └─┬─┘ └┬─┘ └────────┬─────────┘ └─────┬─────┘ └────┬────┘
        timestamp        PID  level     component         request_id    message
Extracted fields:
- timestamp - Log timestamp
- severity - Log level (INFO, WARNING, ERROR)
- component - Service component (e.g., nova.compute.manager)
- request_id - OpenStack request ID for tracing
- message - Log message content
4. Label Enrichment
Adds Loki labels for efficient querying:
processors:
  resource/loki-labels:
    attributes:
      - key: namespace
        from_attribute: k8s.namespace.name
      - key: pod
        from_attribute: k8s.pod.name
      - key: container
        from_attribute: k8s.container.name
      - key: service_name
        from_attribute: service.name
Export to Loki
Processed logs are sent to Loki via OTLP/HTTP:
exporters:
  otlphttp/loki:
    endpoint: "http://loki-gateway.monitoring.svc.cluster.local/otlp"

service:
  pipelines:
    logs/k8s:
      receivers:
        - filelog/k8s_containers
      processors:
        - memory_limiter
        - k8sattributes
        - batch
        - resource/loki-labels
      exporters:
        - otlphttp/loki
        - debug
Loki Log Storage
Overview
Loki is a horizontally scalable, highly available log aggregation system designed for cloud-native environments. Unlike traditional log systems, Loki only indexes labels (not log content), making it extremely cost-effective.
Architecture
Loki is deployed with distributed components:
- Gateway - Receives logs from OpenTelemetry collectors
- Distributor - Routes logs to ingesters
- Ingester - Writes logs to storage and serves recent queries
- Querier - Serves log queries from storage
- Compactor - Compacts and manages stored logs
Label-Based Indexing
Loki indexes logs based on labels, not content:
Traditional approach (expensive):
Loki approach (cost-effective):
Index only labels (namespace, pod, service) → Small index → Low storage costs
Query by labels, then search content → Fast and efficient
Storage Tiers
1. Short-Term Storage (Local)
- Duration: 24-72 hours
- Storage: Local PVCs on Kubernetes nodes
- Purpose: Fast queries for recent logs
2. Long-Term Storage (Object Storage)
- Duration: 30+ days (configurable)
- Storage: S3, Swift, Ceph, or other object storage
- Purpose: Historical log retention, compliance
Configuration
All configurations for Loki and OpenTelemetry are in:
- Loki: genestack/base-helm-configs/loki
- OpenTelemetry: genestack/base-helm-configs/opentelemetry
Review the default deployment settings and adjust for your needs.
Log Storage Operations
How Logs Flow Through the System
- Log Generation in Kubernetes
Applications running in Kubernetes pods generate logs as part of their normal operation, recording events, errors, and other relevant information.
- OpenTelemetry Collection
OpenTelemetry, deployed as a DaemonSet, runs on every node:
- Collects logs from /var/log/pods in real-time
- Parses CRI format and extracts metadata
- Handles multi-line logs (stack traces, exceptions)
- Enriches logs with Kubernetes labels and attributes
- Processing and Batching
OpenTelemetry processors: - Filter unwanted logs - Batch logs for efficient transmission - Add resource attributes for Loki labels - Rate limit to prevent overwhelming Loki
- Sending Logs to Loki
Processed logs are sent to Loki via OTLP/HTTP: - Labels are indexed (namespace, pod, service) - Log content is stored (not indexed) - Timestamps are preserved
- Loki Indexing and Storage
Loki receives and processes logs: - Distributor validates and routes logs - Ingester writes to local storage and memory - Chunks are created (compressed log blocks) - Recent logs are kept in memory for fast queries
- Long-Term Storage
Loki chunks logs into large objects: - Chunks are compressed (gzip or snappy) - Sent to object storage (S3, Swift, Ceph) - Local storage is freed - Index remains small (only labels)
- Object Storage
OpenStack Swift, S3, or Ceph provides: - Durable storage for archived logs - Cost-effective long-term retention - Scalable capacity
Key Benefits of This Architecture
✅ Efficient Log Collection - OpenTelemetry's lightweight design ensures minimal resource usage - Automatic discovery of new pods and services - Built-in retry and backpressure handling
✅ Cost-Effective Storage - Loki only indexes labels (not content) → 10x smaller index - Compressed chunks reduce storage costs - Object storage is cheaper than database storage
✅ Scalable Log Aggregation - Loki's distributed architecture handles billions of log lines - Horizontal scaling by adding more ingesters/queriers - No single point of failure
✅ Flexible Log Retention - Short-term: Fast queries from local storage - Long-term: Cost-effective object storage - Configurable retention per label (e.g., keep errors longer)
✅ Powerful Log Querying - LogQL provides Prometheus-like syntax for logs - Filter by labels, then search content - Aggregate log data (rate, count, percentiles)
✅ Secure and Reliable Storage - Object storage provides durability (99.999999999%) - Encryption at rest and in transit - Multi-region replication (if configured)
Accessing Logs Through Grafana
The logs that Loki stores can be searched and analyzed through Grafana's Explore interface.
Accessing Grafana
# Port-forward to Grafana
kubectl -n monitoring port-forward svc/grafana 3000:80

# Open browser to http://localhost:3000
# Username: admin
# Password: (from secret)
Using Grafana Explore
From the left-side menu, select Explore to enter LogQL queries.
Step 1: Select Loki Datasource
Choose Loki from the datasource dropdown at the top.
Step 2: Build Your Query
Basic Label Filtering
Start by selecting labels to filter logs:
Available labels:
- namespace - Kubernetes namespace (openstack, kube-system, monitoring)
- pod - Pod name
- container - Container name
- service_name - OpenStack service (nova, neutron, keystone)
- application - Application name
- severity - Log level (INFO, WARNING, ERROR)
Combining Labels
Use multiple labels to narrow results:
Searching Log Content
Filter by content using |= (contains) or != (doesn't contain):
Regular Expression Search
Use |~ for regex matching:
Example Queries
1. Find Errors in Nova Service
2. Search for a Specific Project ID
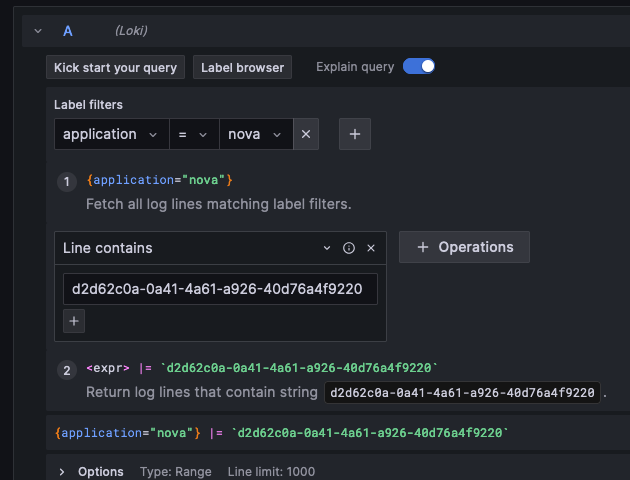
3. Find Logs for a Specific Server UUID
4. Filter by Request ID (Trace Across Services)
This shows all logs related to a single OpenStack request across all services.
5. Show Only Critical Errors
6. Logs from Specific Pod
7. Rate of Errors Over Time
This shows the rate of errors per second over 5-minute windows.
8. Count Logs by Service
Shows log volume per OpenStack service in the last hour.
Label Matching Operators
| Operator | Description | Example |
|---|---|---|
= |
Exactly equal | {namespace="openstack"} |
!= |
Not equal | {namespace!="kube-system"} |
=~ |
Regex matches | {service_name=~"nova\|neutron"} |
!~ |
Regex does not match | {pod!~".*test.*"} |
Content Matching Operators
| Operator | Description | Example |
|---|---|---|
\|= |
Line contains | \|= "ERROR" |
!= |
Line doesn't contain | != "DEBUG" |
\|~ |
Line matches regex | \|~ "ERROR\|CRITICAL" |
!~ |
Line doesn't match regex | !~ "^INFO" |
Advanced Query Features
Parsing JSON Logs
If logs are in JSON format:
Extracting Fields
Extract specific fields from logs:
Log Context
View logs before and after a specific entry: 1. Click on a log line in Grafana 2. Click "Show Context" 3. See surrounding log entries
Live Tail
Stream logs in real-time: 1. Click the "Live" button in Grafana Explore 2. Logs appear as they're ingested 3. Useful for debugging active issues
Common Use Cases
Debugging Application Errors
Scenario: Nova API is returning 500 errors
Query:
Next steps: 1. Find the request ID in the log 2. Search for that request ID across all services:
3. See the full request flow from API → database → computeMonitoring Failed Operations
Scenario: Track failed volume attachments
Query:
Create alert:
- name: volume-attach-failures
  expr: |
    rate({namespace="openstack", service_name="cinder"} |= "attach" |= "failed" [5m]) > 0.1
  annotations:
    summary: "High rate of volume attach failures"
Security Auditing
Scenario: Track all authentication failures
Query:
Performance Investigation
Scenario: Find slow database queries
Query:
Extract query duration and alert on slow queries.
Compliance and Retention
Scenario: Export logs for compliance
Query in logcli:
logcli --since=30d --quiet \
  '{namespace="openstack", service_name="keystone"}' \
  --output=jsonl \
  > keystone-audit-logs.jsonl
Using logcli (Command-Line Interface)
Installation
# Download logcli
wget https://github.com/grafana/loki/releases/download/v2.9.0/logcli-linux-amd64.zip
unzip logcli-linux-amd64.zip
chmod +x logcli-linux-amd64
sudo mv logcli-linux-amd64 /usr/local/bin/logcli
Configuration
# Set Loki endpoint
export LOKI_ADDR=http://loki-gateway.monitoring.svc.cluster.local

# Or port-forward and use localhost
kubectl -n monitoring port-forward svc/loki-gateway 3100:80 &
export LOKI_ADDR=http://localhost:3100
Example Commands
Query Logs
Search with Time Range
Tail Logs (Live Stream)
Export Logs
logcli query --since=24h --quiet \
  '{namespace="openstack"}' \
  --output=jsonl \
  > openstack-logs.jsonl
Search for Project ID
logcli query --since=15m \
  '{namespace="openstack", service_name=~"nova|placement"} |~ `project-id-abc-123`' \
  --output=raw
logcli Output Formats
| Format | Description | Use Case |
|---|---|---|
default |
Human-readable with colors | Interactive terminal use |
raw |
Just the log messages | Piping to other tools |
jsonl |
JSON lines format | Structured log export |
labels |
Show labels only | Understanding log structure |
Log Retention and Storage
Retention Policies
Configure retention per stream in Loki:
# loki-config.yaml
limits_config:
  retention_period: 744h  # 31 days

table_manager:
  retention_deletes_enabled: true
  retention_period: 744h
Storage Backends
S3 (Amazon or S3-compatible)
OpenStack Swift
storage_config:
  swift:
    auth_url: https://keystone.example.com/v3
    username: loki
    project_name: monitoring
    region_name: RegionOne
    container_name: loki-logs
Ceph (S3-compatible)
Compaction
Loki automatically compacts logs:
- Chunks are created (10-minute blocks)
- Compaction merges small chunks
- Upload to object storage
- Cleanup of local storage
This reduces storage costs and improves query performance.
Troubleshooting
No Logs Appearing
Check OpenTelemetry collectors:
Verify logsCollection preset:
kubectl get opentelemetrycollector -n monitoring opentelemetry-kube-stack-daemon -o yaml | grep -A 5 logsCollection
Should show:
Slow Queries
Optimize by adding more specific labels:
❌ Slow:
✅ Fast:
High Storage Usage
Check log volume:
Reduce retention or filter noisy logs:
# In OpenTelemetry config
processors:
  filter/drop-debug:
    logs:
      exclude:
        match_type: strict
        severity_texts: ["DEBUG", "TRACE"]
Additional Resources
Documentation
- Grafana Loki Official Documentation
- LogQL Query Language
- logcli Command Reference
- OpenTelemetry Filelog Receiver
- Genestack Observability Overview
- Getting Started with Monitoring
Configuration Files
- Loki Helm values:
genestack/base-helm-configs/loki - OpenTelemetry Helm values:
genestack/base-helm-configs/opentelemetry