Prometheus Monitoring Overview
Genestack utilizes Prometheus for monitoring, alerting and metrics collection. To read more about Prometheus please take a look at the upstream docs.
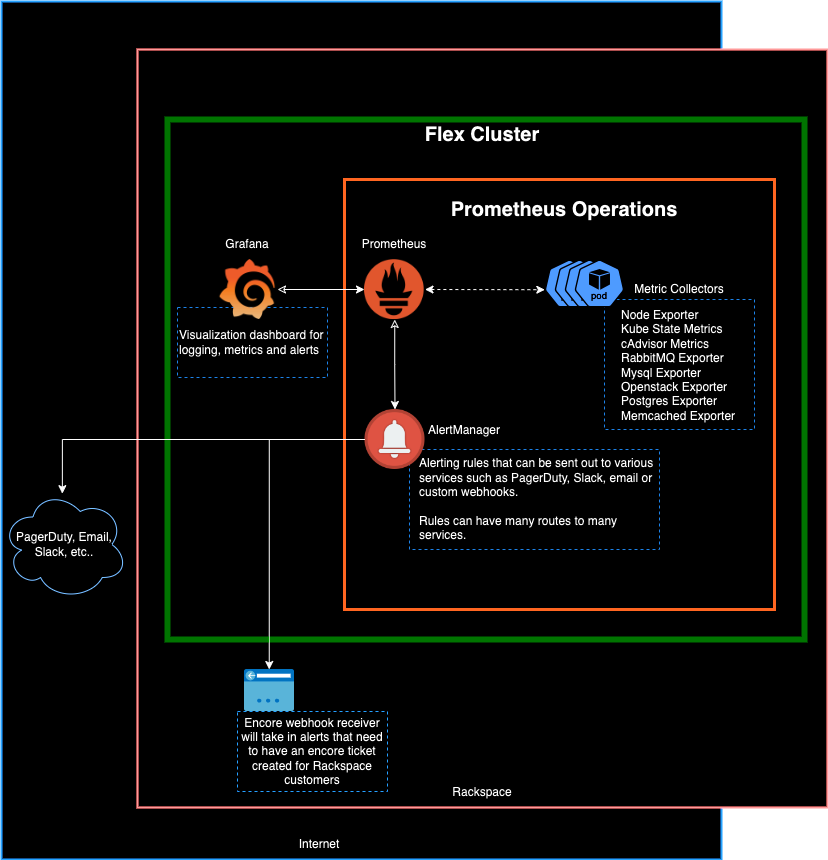
Components used to monitor and provide alerting and visualization mechanisms for genestack include:
- Prometheus
- AlertManager
- Grafana
Prometheus makes use of various metric exporters used to collect monitoring data related to specific services:
- Node Exporter(Hardware metrics)
- Kube State Exporter(Kubernetes cluster metrics)
- Mysql Exporter(MariaDB/Galera metrics)
- RabbitMQ Exporter(RabbitMQ queue metrics)
- Postgres Exporter(Postgresql metrics)
- Memcached Exporter(Memcached metrics)
- Openstack Exporter(Metrics from various Openstack products)
Getting started with genestack monitoring
To get started using monitoring within the genestack ecosystem begin with the getting started page